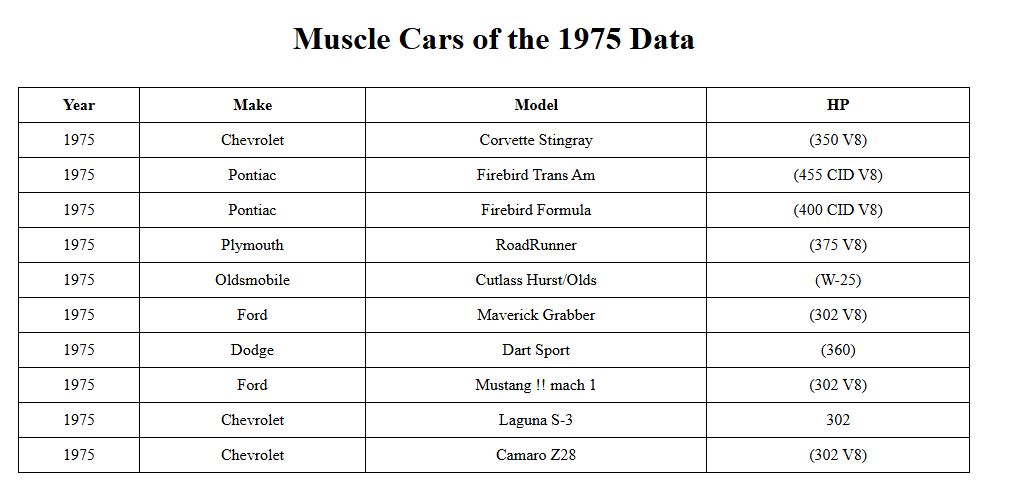
Building on our last article, we’ll clean up the look and feel of the table. Displaying data is the foundation of every site, but without styling the data doesn’t really matter. Let’s dive in.
This is what we want the screen to look like. While we’re showing simple attributes, we’ll also show the key steps that make it happen.
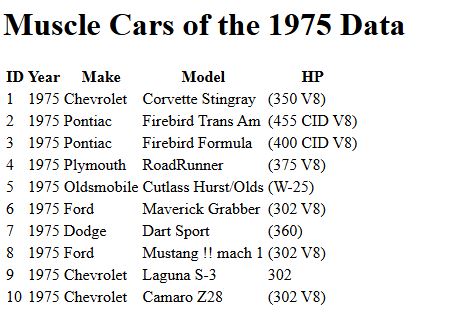
We’ll keep things simple yet powerful: remove the ID column from the visual display, but retain it as a data‑row attribute.
This hidden attribute will be handy later when we need to manipulate individual rows. Meanwhile, we’ll align the data rows and give the table a clean border.
Adding a data-id attribute to each tr makes it easy to target and select any row when the time comes.
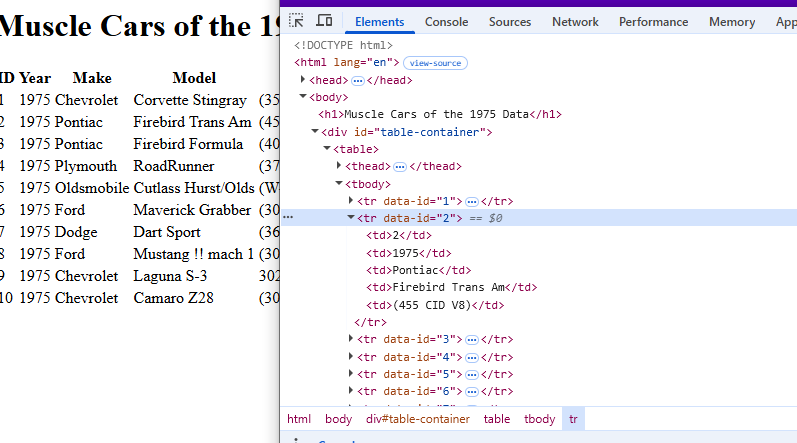
The code below shows how to hide the ID column while preserving the data‑id attribute on each tr. This keeps the identifier available for later row‑level operations.
Change this line from:
d3ObjectsResources.js
    // Load table methods
    PopulateTable = (data) => {
        const columns = ["ID","Year","Make","Model","HP"];
        const table = d3.select("#table-container").append("table");
to:
d3ObjectsResources.js
    PopulateTable = (data) => {
        const columns = ["Year","Make","Model","HP"];
        const table = d3.select("#table-container").append("table");
You can remove the ID in several ways. You could find the element and delete it from the DOM, but I prefer a simple, readable approach. Everyone will have their own opinion on the “best” way, but the real question is how easy the code is to understand without extra context. In this example, I’ll show how D3 makes it clean and straightforward.
Keeping all styling in a stylesheet—whether it’s an external CSS file or a <style> block in the HTML—lets you adjust the look of your page quickly and consistently.
The purpose of this article is to show how D3 can add attributes and classes directly to elements, making it straightforward to apply and manage those styles.
Here’s the section of code we’ll be changing:
d3ObjectsResources.js
thead.append("tr")
    .selectAll("th")
    .data(columns) // Bind column names to header cells
    .enter()
    .append("th")
    .text(d => d);
// Create a row for each object in the data
const rows = tbody.selectAll("tr")
    .data(data)
    .enter()
    .append("tr")
    .attr("data-id", function(d) { return d.ID; });
// Create a cell in each row for each column
const cells = rows.selectAll("td")
    .data(function(row) {
        // Map the row data to an array of objects for each cell
        return columns.map(function(column) {
            return { column: column, value: row[column] };
        });
    })
    .enter()
    .append("td")
    .html(d => d.value); // Set the cell text to the value
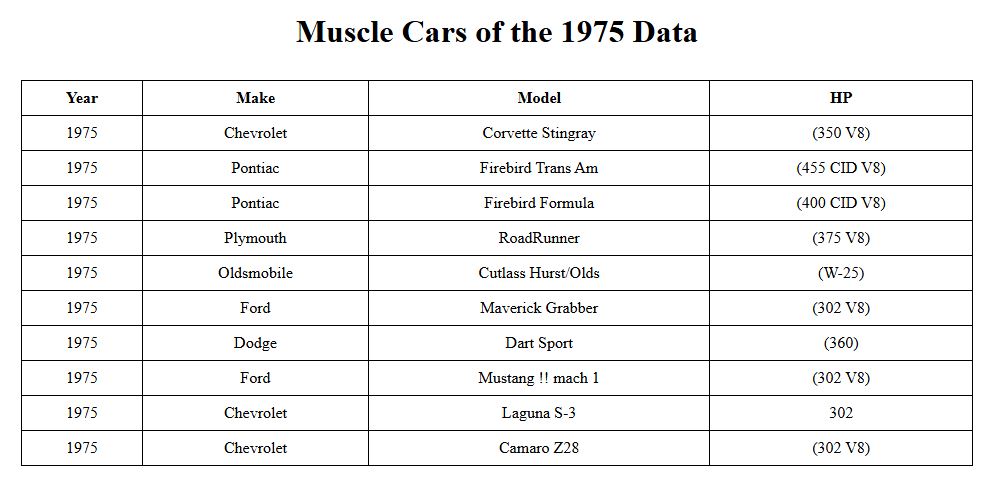
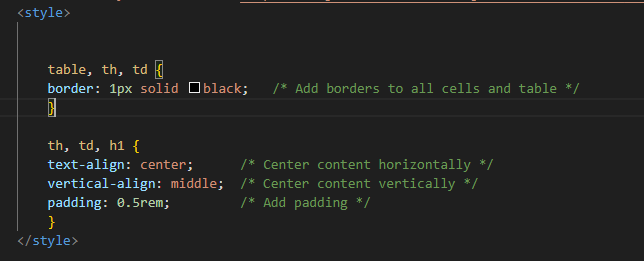
Let’s spend the rest of the time polishing a few CSS tweaks: center the text, vertical‑align it, and add 0.5 rem padding.
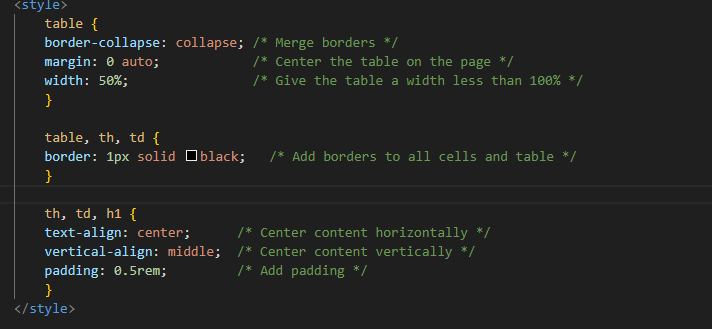
Finally, we’ll update the table layout: merge borders, center the table on the page, and set its width to less than 100 %.
The finaly product for this article will look something like this